Add context to your data by adding a percentile bar to the actual values. The percentile bar is colored with a color scale based on a user supplied color palette and the relative width of the bars will be rendered as tooltip.
Usage
gt_pct_bar(
  gt_tbl,
  col_value,
  col_pct,
  ...,
  rows = gt::everything(),
  hide_col_pct = FALSE,
  value_position = c("inline", "above"),
  value_scale = 1L,
  value_padding_left = "0px",
  value_padding_right = "0px",
  value_colors = c("black", "white"),
  value_style.props = list(),
  fill_palette = "hulk",
  fill_palette.reverse = FALSE,
  fill_na.color = "#808080",
  fill_pct.domain = 0:100,
  fill_border.color = "transparent",
  fill_border.radius = "10px",
  fill_height = "100%",
  fill_style.props = list(),
  background_border.color = "thin solid black",
  background_border.radius = "12px",
  background_fill.color = "#b1b1b1",
  background_fill.width = "100%",
  background_fill.height = "100%",
  background_style.props = list()
)
Arguments
- gt_tbl
A table object that is created using the
gt::gt()function.- col_value
Column name of the value to be printed.
- col_pct
Column name of percentage values controlling the fill width. If this is not in a 0 - 100 range, use
value_scaleto scale it up.- ...
These dots are for future extensions and must be empty.
- rows
Rows to target
<row-targeting expression>// default:everything()In conjunction with
columns, we can specify which of their rows should form a constraint for extraction. The defaulteverything()results in all rows incolumnsbeing formatted. Alternatively, we can supply a vector of row IDs withinc(), a vector of row indices, or a select helper function (e.g.starts_with(),ends_with(),contains(),matches(),num_range(), andeverything()). We can also use expressions to filter down to the rows we need (e.g.,[colname_1] > 100 & [colname_2] < 50).- hide_col_pct
If
TRUE, the column incol_pctwill be hidden in the resulting table.- value_position
One of the following:
"inline": prints the value inside of the bars"above": prints the value above the bars
- value_scale
A scaling factor: values from column
col_pctwill be multiplied byvalue_scalebefore proceeding. This is useful if the underlying data is in a 0 - 1 range, instead of the required 0 - 100 range.- value_padding_left
Left padding of the printed text.
- value_padding_right
Right padding of the printed text.
- value_colors
One or more colors of the printed text. If this is a vector of colors and
value_position = "inline", the function will calculate color contrast ratios with colorspace::contrast_ratio and, based on this, decide which of the colors to chose to maximize readability. You can overwrite the resulting colos withvalue_style.props. NOTE: this uses colors fromfill_palettefor contrast ratio calculations and not frombackground_fill.colorbecause it is not trivial to figure out the actual background of the text (it could overlap with both).- value_style.props
A named list of the form
list(property = value)for enhanced control of the html style property. This can overwrite the default properties set with the abovevalue_arguments.- fill_palette
The colors that values will be mapped to. This can also be one of
"hulk","hulk_teal", or"blue_orange"which will trigger internal color palettes. Argument passed on to scales::col_numeric.- fill_palette.reverse
Whether the vector of colors in
fill_paletteshould be reversed. Argument passed on to scales::col_numeric.- fill_na.color
Fill color in case of
NAvalues. Argument passed on to scales::col_numeric.- fill_pct.domain
The possible values that colors in
fill_palettecan be mapped to.- fill_border.color
Border color of color filled area.
- fill_border.radius
Border radius of color filled area.
- fill_height
The height of the colored fill bar. Should correspond with
background_fill.height. This defaults to 100% which will make sure the bar height matches text size of the printed value (whenvalue_position = "inline"). Please note thatvalue_position = "inline"requires an absolute value offill_height, (e.g.5px), otherwise it will render as line.- fill_style.props
A named list of the form
list(property = value)for enhanced control of the html style property. This can overwrite the default properties set with the abovefill_arguments.- background_border.color
Border color of background.
- background_border.radius
Border radius of background.
- background_fill.color
Fill color of background.
- background_fill.width
Width of background.
- background_fill.height
The height of the colored background bar. Should correspond with
fill_height. This defaults to 100% which will make sure the bar height matches text size of the printed value (whenvalue_position = "inline"). Please note thatvalue_position = "inline"requires an absolute value ofbackground_fill.height, (e.g.5px), otherwise it will render as line.- background_style.props
A named list of the form
list(property = value)for enhanced control of the html style property. This can overwrite the default properties set with the abovebackground_arguments.
Details
The function allows extensive styling of the bars and text, either by using
some of the default arguments or, if you want full control, by using the
*_style.props lists which give you full control over all style properties.
All styling parameters are interpreted as style properties of a html span tag.
For more information on CSS properties, see
https://www.w3schools.com/cssref/index.php.
Some notes about styling
Since this is meant to be an extension of an already existing 'gt' table,
you'll have to do some styling outside of this function, esp. the horizontal
alignment and direction will be controlled by gt::cols_align (see example).
Make sure to play around with fill_border.radius and
background_border.radius. Results will depend on final column width and
percentiles. Very short percentile bars, i.e. small values in col_pct,
might result in bars crossing the border when combined with a
big border radius.
Text alignment depending on the colored bar isn't as easy as one might think.
Try percent values in value_padding_left or value_padding_right to avoid
overlapping of text values and the outline of the colored bars.
For more information and examples, see the article that describes how nflplotR works with the 'gt' package https://nflplotr.nflverse.com/articles/gt.html.
See also
The article that describes how nflplotR works with the 'gt' package https://nflplotr.nflverse.com/articles/gt.html
Examples
library(data.table)
# Make a data.table of mtcars and select only disp and hp
data <- data.table::as.data.table(mtcars)[, list(disp, hp)]
# Add the percentile of hp in the distribution of hp values
data[, pct := round(stats::ecdf(hp)(hp) * 100, 1)]
#> disp hp pct
#> <num> <num> <num>
#> 1: 160.0 110 43.8
#> 2: 160.0 110 43.8
#> 3: 108.0 93 21.9
#> 4: 258.0 110 43.8
#> 5: 360.0 175 68.8
#> 6: 225.0 105 31.2
#> 7: 360.0 245 93.8
#> 8: 146.7 62 6.2
#> 9: 140.8 95 25.0
#> 10: 167.6 123 53.1
#> 11: 167.6 123 53.1
#> 12: 275.8 180 78.1
#> 13: 275.8 180 78.1
#> 14: 275.8 180 78.1
#> 15: 472.0 205 81.2
#> 16: 460.0 215 84.4
#> 17: 440.0 230 87.5
#> 18: 78.7 66 15.6
#> 19: 75.7 52 3.1
#> 20: 71.1 65 9.4
#> 21: 120.1 97 28.1
#> 22: 318.0 150 59.4
#> 23: 304.0 150 59.4
#> 24: 350.0 245 93.8
#> 25: 400.0 175 68.8
#> 26: 79.0 66 15.6
#> 27: 120.3 91 18.8
#> 28: 95.1 113 46.9
#> 29: 351.0 264 96.9
#> 30: 145.0 175 68.8
#> 31: 301.0 335 100.0
#> 32: 121.0 109 34.4
#> disp hp pct
#> <num> <num> <num>
# set seed to keep it reproducible
set.seed(20)
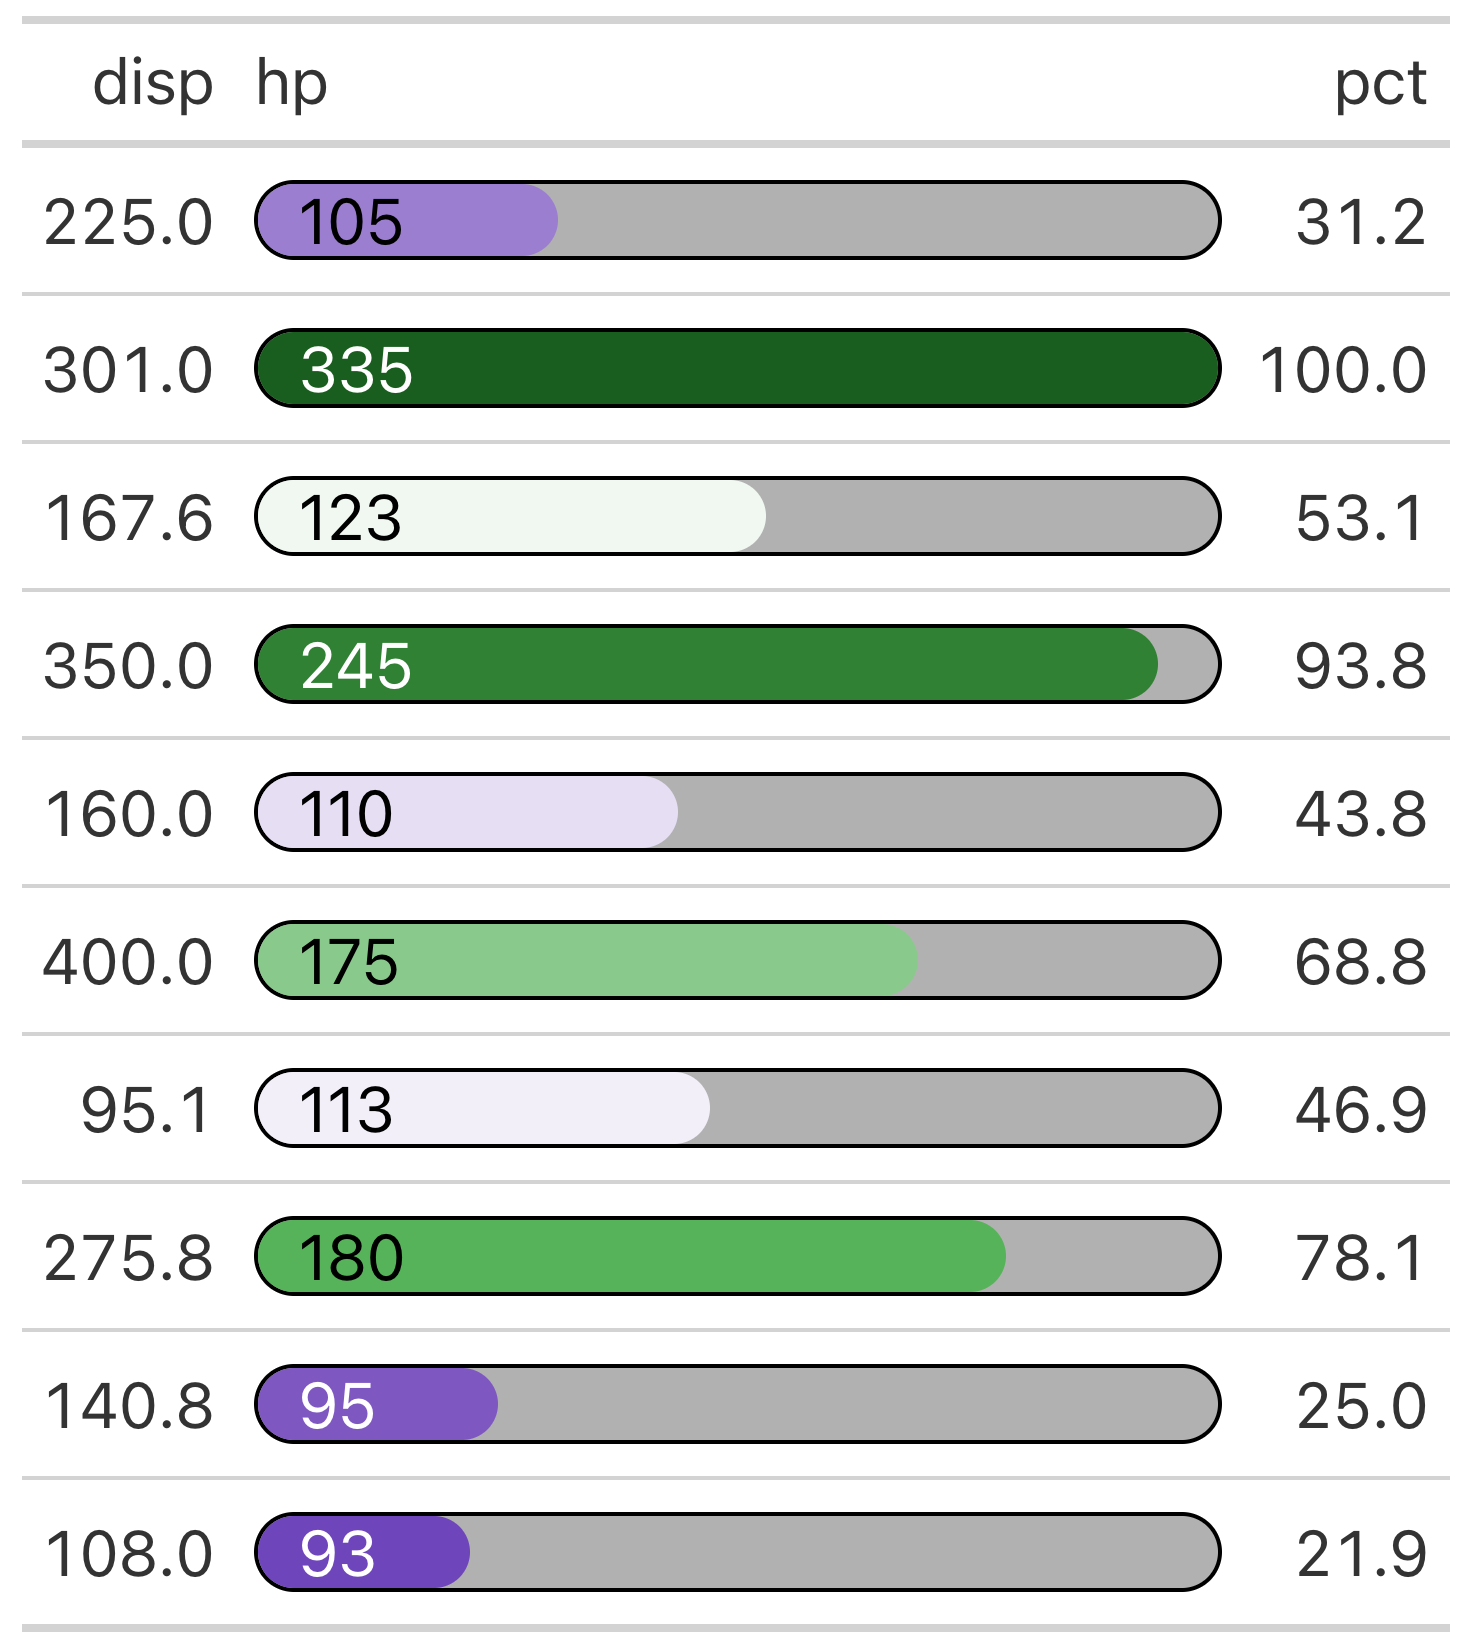
# take random sample (to avoid a big table) and add the percent bars for hp
# using the percentiles in the pct variable
table <- data[sample(.N, 10)] |>
gt::gt() |>
nflplotR::gt_pct_bar(
"hp", "pct",
hide_col_pct = FALSE,
value_padding_left = "10px",
) |>
gt::cols_align("left", hp) |>
gt::cols_width(hp ~ gt::px(250))