These geoms can be used to draw horizontal or vertical reference
lines in a ggplot. They use the data in the aesthetics x0 and y0
to compute their median or mean and draw them as a line.
Arguments
- ...
Arguments passed on to
ggpath::geom_mean_lines,ggpath::geom_median_linesmappingSet of aesthetic mappings created by
aes().dataThe data to be displayed in this layer. There are three options:
If
NULL, the default, the data is inherited from the plot data as specified in the call toggplot().A
data.frame, or other object, will override the plot data. All objects will be fortified to produce a data frame. Seefortify()for which variables will be created.A
functionwill be called with a single argument, the plot data. The return value must be adata.frame, and will be used as the layer data. Afunctioncan be created from aformula(e.g.~ head(.x, 10)).na.rmIf
FALSE, the default, missing values are removed with a warning. IfTRUE, missing values are silently removed.show.legendlogical. Should this layer be included in the legends?
NA, the default, includes if any aesthetics are mapped.FALSEnever includes, andTRUEalways includes. It can also be a named logical vector to finely select the aesthetics to display. To include legend keys for all levels, even when no data exists, useTRUE. IfNA, all levels are shown in legend, but unobserved levels are omitted.inherit.aesIf
FALSE, overrides the default aesthetics, rather than combining with them. This is most useful for helper functions that define both data and aesthetics and shouldn't inherit behavior from the default plot specification.
Value
A ggplot2 layer (ggplot2::layer()) that can be added to a plot
created with ggplot2::ggplot().
Details
These functions have been outsourced to the ggpath package.
See ggpath::geom_median_lines and ggpath::geom_mean_lines for details.
Aesthetics
geom_median_lines() and geom_mean_lines() understand the following
aesthetics (at least one of the x0 or y0 aesthetics is required):
x0The variable for which to compute the median/mean that is drawn as vertical line.
y0The variable for which to compute the median/mean that is drawn as horizontal line.
alpha = NAThe alpha channel, i.e. transparency level, as a numerical value between 0 and 1.
color = "red"The color of the drawn lines.
linetype = 2The linetype of the drawn lines.
linewidth = 0.5The width of the drawn lines.
See also
The underlying ggplot2 geoms ggplot2::geom_hline and ggplot2::geom_vline
Examples
library(ggplot2)
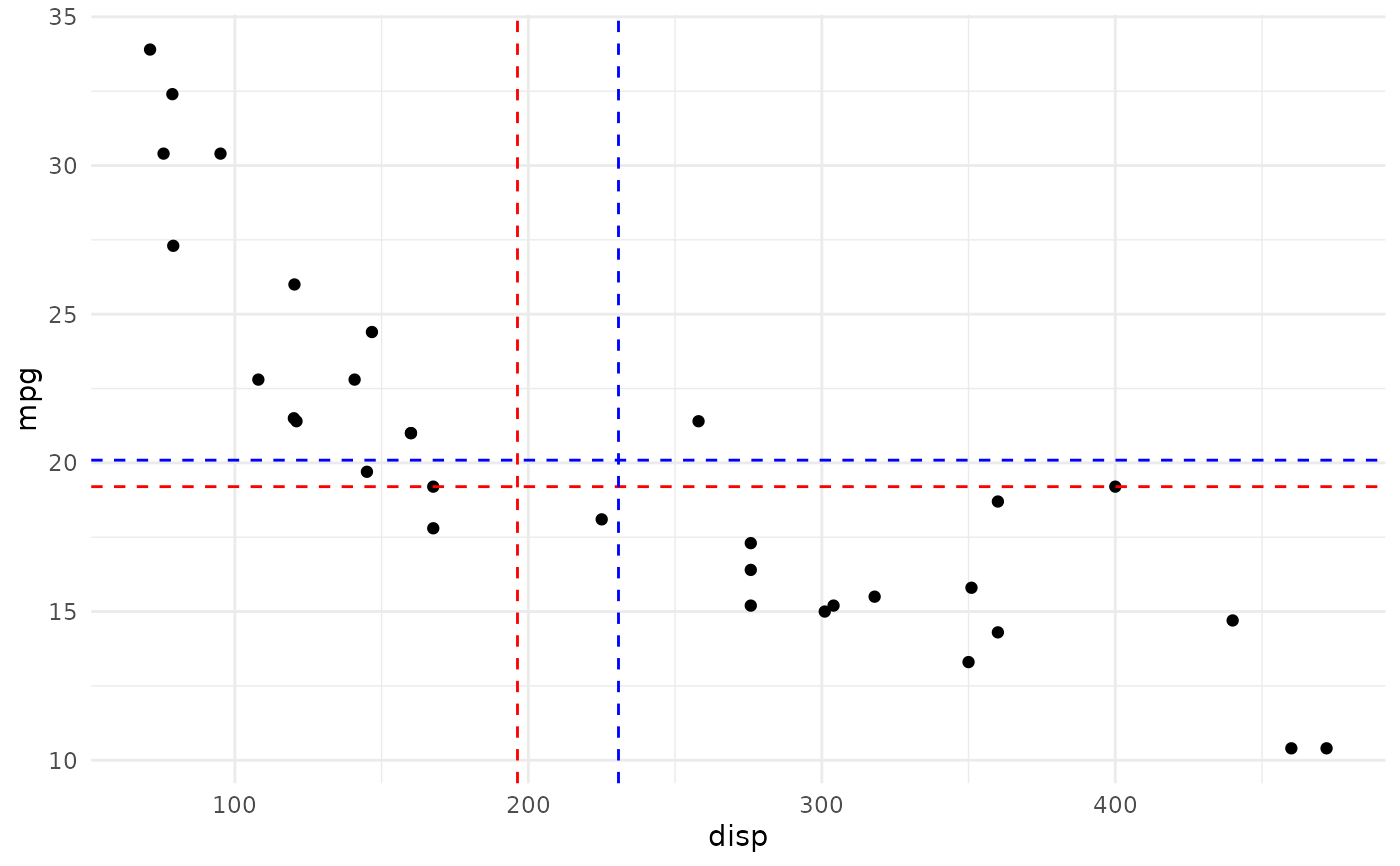
# inherit top level aesthetics
ggplot(mtcars, aes(x = disp, y = mpg, y0 = mpg, x0 = disp)) +
geom_point() +
geom_median_lines() +
geom_mean_lines(color = "blue") +
theme_minimal()
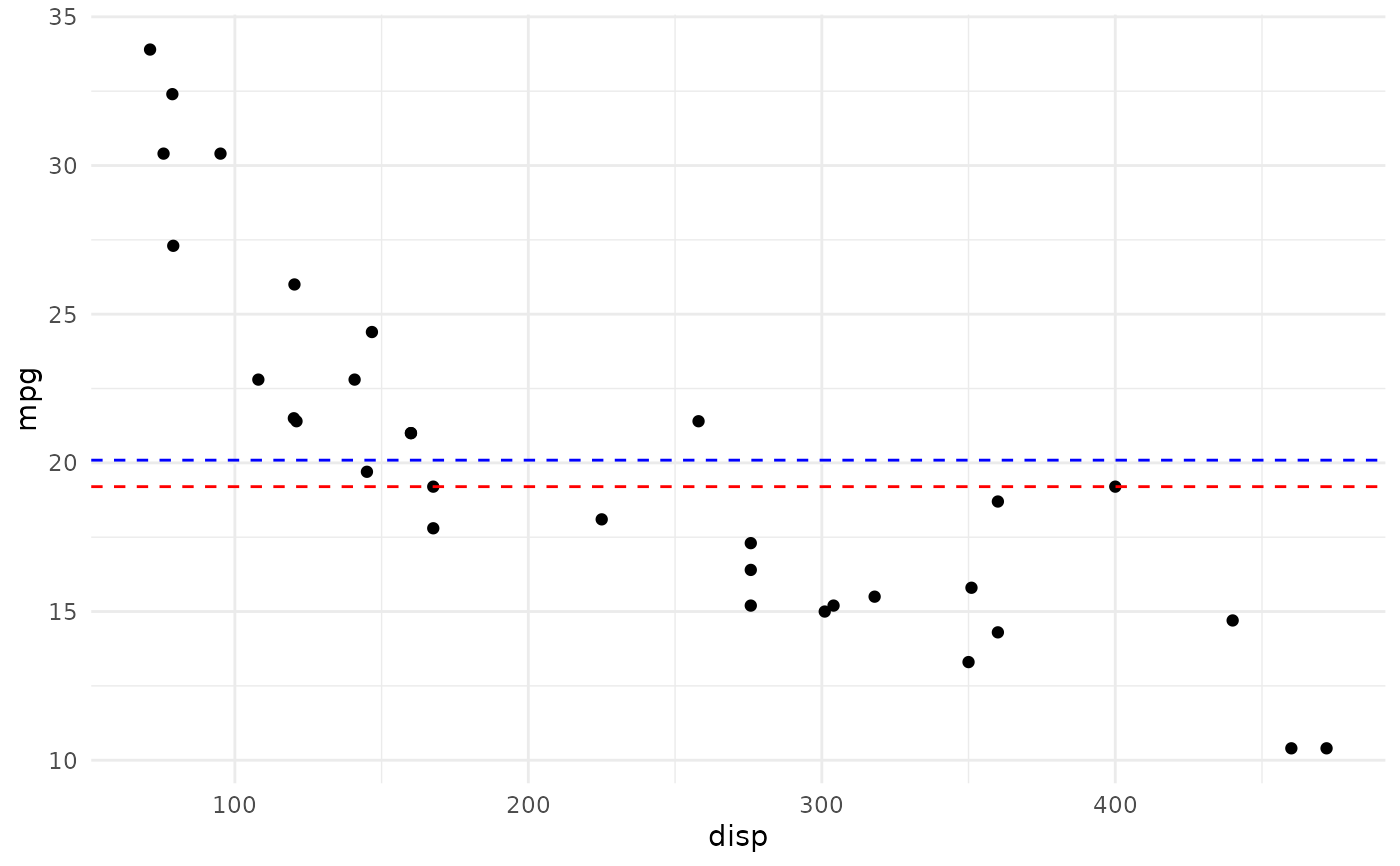
 # draw horizontal line only
ggplot(mtcars, aes(x = disp, y = mpg, y0 = mpg)) +
geom_point() +
geom_median_lines() +
geom_mean_lines(color = "blue") +
theme_minimal()
# draw horizontal line only
ggplot(mtcars, aes(x = disp, y = mpg, y0 = mpg)) +
geom_point() +
geom_median_lines() +
geom_mean_lines(color = "blue") +
theme_minimal()
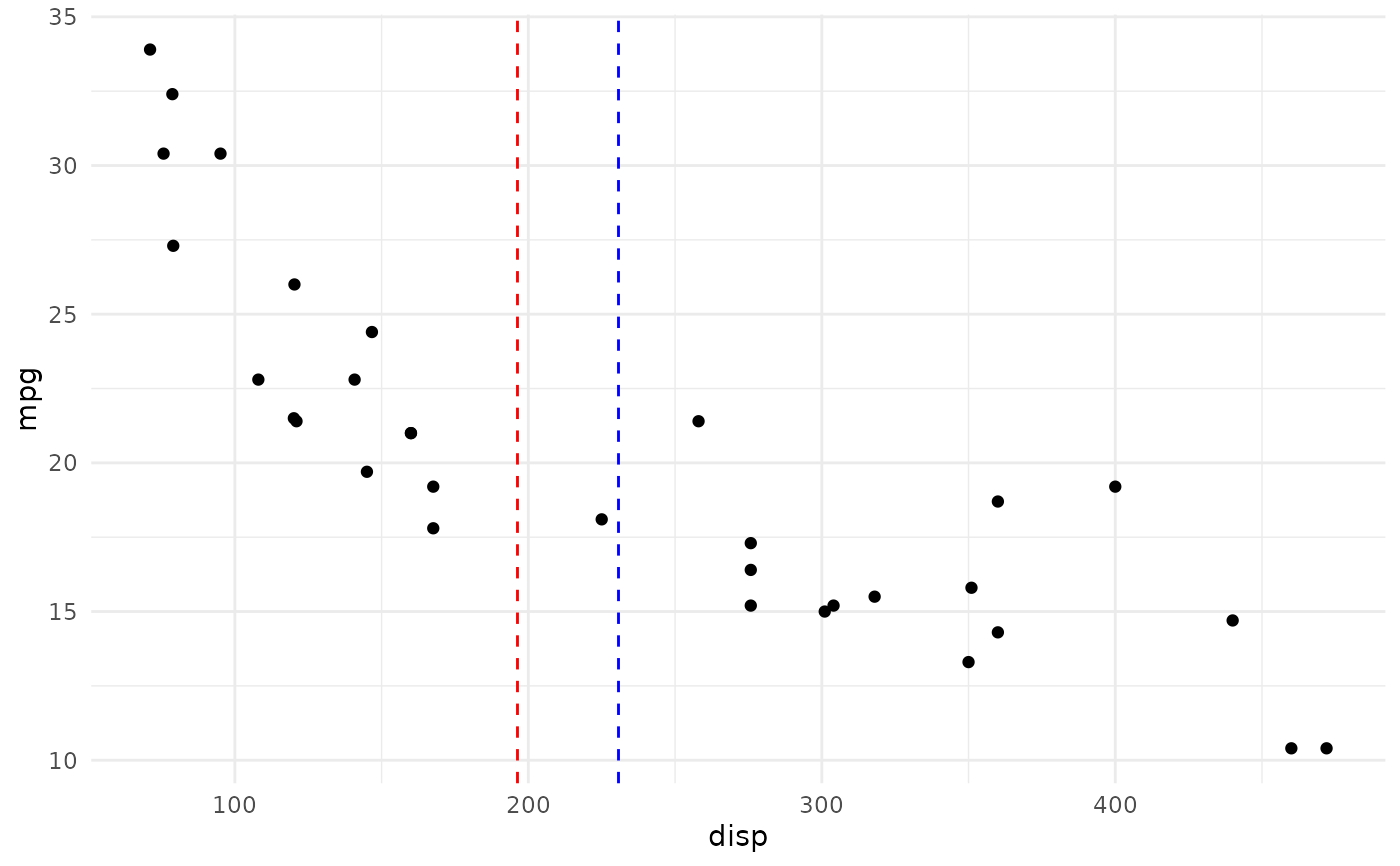
 # draw vertical line only
ggplot(mtcars, aes(x = disp, y = mpg, x0 = disp)) +
geom_point() +
geom_median_lines() +
geom_mean_lines(color = "blue") +
theme_minimal()
# draw vertical line only
ggplot(mtcars, aes(x = disp, y = mpg, x0 = disp)) +
geom_point() +
geom_median_lines() +
geom_mean_lines(color = "blue") +
theme_minimal()
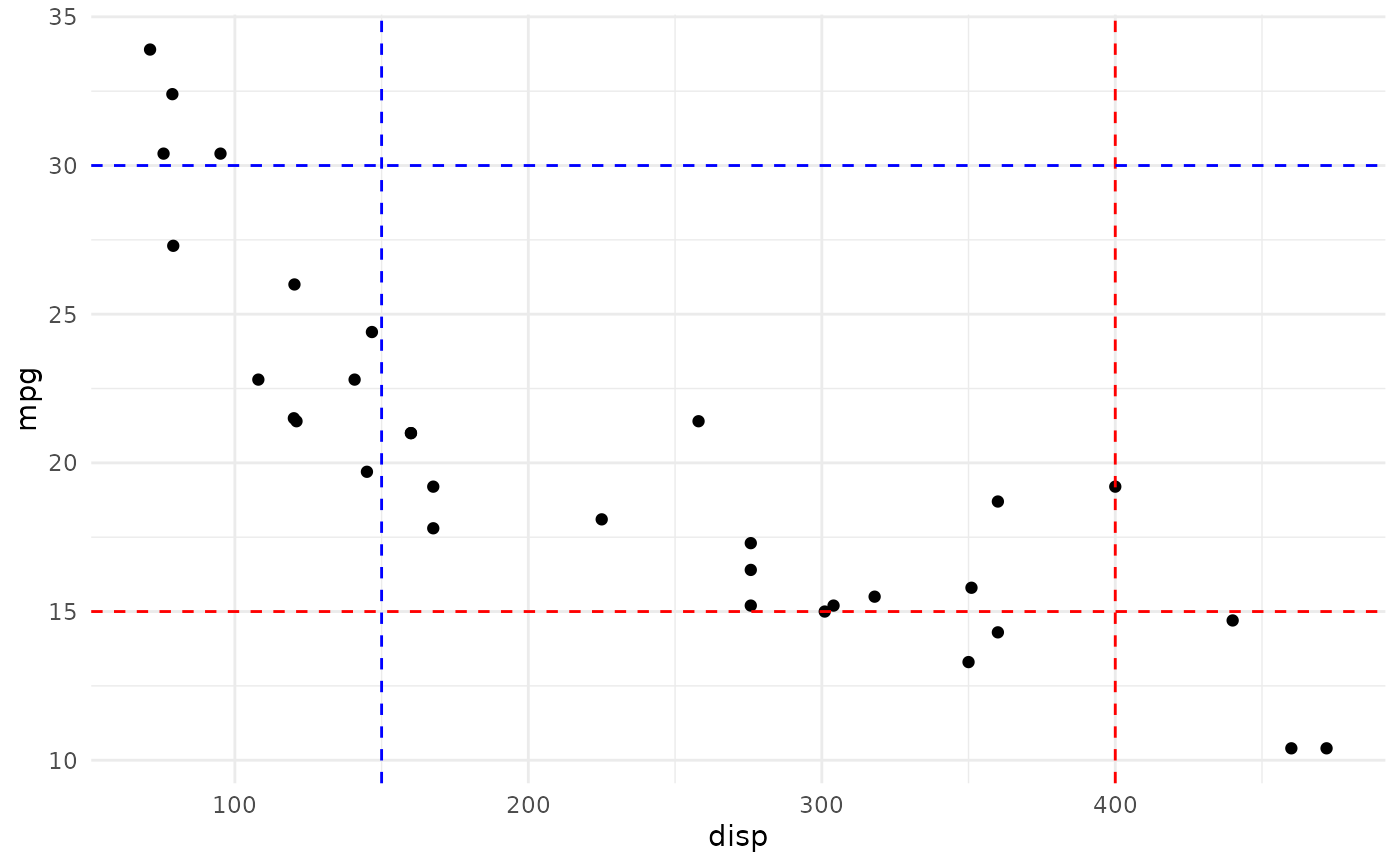
 # choose your own value
ggplot(mtcars, aes(x = disp, y = mpg)) +
geom_point() +
geom_median_lines(x0 = 400, y0 = 15) +
geom_mean_lines(x0 = 150, y0 = 30, color = "blue") +
theme_minimal()
# choose your own value
ggplot(mtcars, aes(x = disp, y = mpg)) +
geom_point() +
geom_median_lines(x0 = 400, y0 = 15) +
geom_mean_lines(x0 = 150, y0 = 30, color = "blue") +
theme_minimal()